Imagine having the power to analyze thousands of Amazon products in seconds, uncovering hidden gems, identifying overpriced items, and discovering the most popular products in your niche. Sounds like a dream, right? For one data enthusiast, this dream became a reality with the creation of the Amazon Scraping and Analytics App—a powerful tool designed to transform raw data into actionable insights. In this case study, we’ll dive into how this app was built, the challenges overcome, and the incredible value it delivers to users.
—
The Problem:
In the fast-paced world of e-commerce, data is king. Sellers, marketers, and product researchers need to make informed decisions quickly. However, manually analyzing thousands of products on Amazon is time-consuming and inefficient. Key questions like:
– Which products offer the best value for money?
– What are the most popular products in a category?
– Which suppliers are dominating the market?
– What keywords are driving customer interest?
These questions remained unanswered without a robust tool to scrape, analyze, and visualize Amazon data.
—
The Solution:
The Amazon Scraping and Analytics App was developed to address these challenges. Built using Python and Streamlit, this app combines web scraping, data analysis, and interactive visualizations to provide actionable insights. Here’s how it works:
1. Web Scraping: A custom scraper extracts product data (e.g., ASIN, name, price, rating, reviews, features, and supplier information) from Amazon.
2. Data Analysis: The app calculates key metrics like average ratings, total reviews, and discount percentages.
3. Visualizations: Interactive charts and graphs (built with Matplotlib, Seaborn, and Plotly) make it easy to spot trends and patterns.
4. Keyword Analysis: Using NLP techniques, the app identifies frequently mentioned keywords in product features and correlates them with ratings.
—
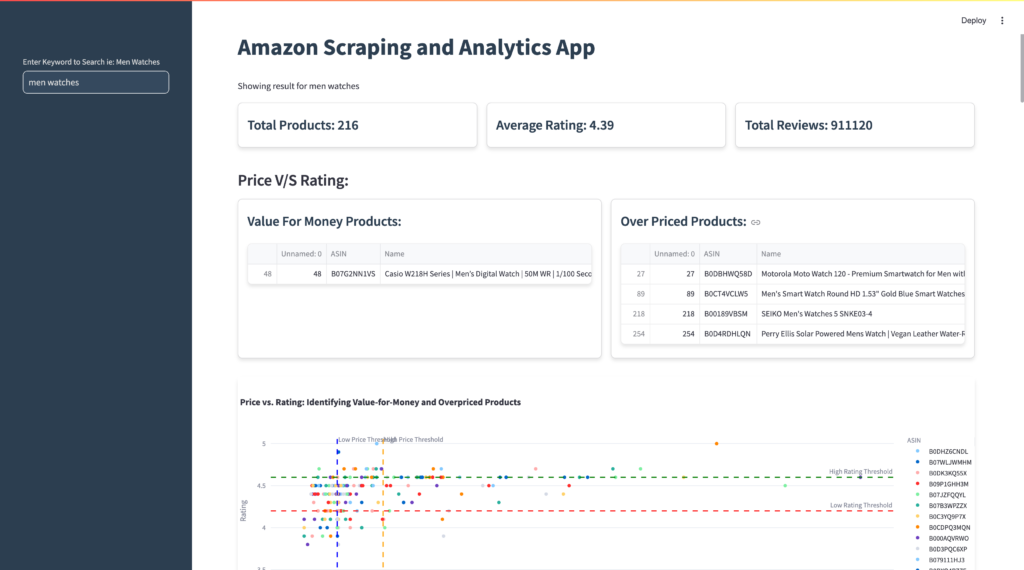
Key Features and Insights:
1. Price vs. Rating Analysis
– Identifies value-for-money products (low price, high rating) and overpriced products (high price, low rating).
– Interactive scatter plots with threshold lines for quick decision-making.
2. Discount Analysis
– Breaks down discounts into ranges (0-10%, 10-20%, 20-30%, 30%+).
– Highlights products with the highest discounts.
3. Popularity Analysis
– Ranks products based on a combined metric of ratings and reviews.
– Visualizes the top 20 most popular products.
4. Supplier Insights
– Identifies the top 5 suppliers by the number of products and highest-rated products.
5. Keyword Trends
– Generates a word cloud of frequently mentioned keywords.
– Analyzes the correlation between keywords and product ratings.
—
The Impact:
This app has transformed the way users interact with Amazon data. Here’s what it delivers:
– Time Savings: Automates data collection and analysis, saving hours of manual work.
– Data-Driven Decisions: Provides actionable insights to optimize pricing, marketing, and product selection.
– Competitive Edge: Helps users identify trends and opportunities before their competitors.
—
The Technology Stack:
– Python: For data scraping, cleaning, and analysis.
– Streamlit: For building the interactive web app.
– Pandas: For data manipulation.
– Matplotlib & Seaborn: For static visualizations.
– Plotly: For interactive charts.
– NLTK: For natural language processing (keyword extraction).
– WordCloud: For generating visual representations of keywords.
—
Why This Matters:
In today’s competitive e-commerce landscape, data is the key to success. The Amazon Scraping and Analytics App empowers users to make smarter decisions, optimize their strategies, and stay ahead of the competition. Whether you’re a seller, marketer, or data enthusiast, this app is a game-changer.
—
Ready to unlock the power of Amazon data? Try the Amazon Scraping and Analytics App today and take your e-commerce strategy to the next level.
👉 Check out the GitHub repository: Click for Code
👉 Follow me on Linkedin: Click here
Let’s revolutionize e-commerce analytics together! 🚀
—
What’s your biggest challenge when analyzing e-commerce data? Let’s discuss in the comments below! 👇